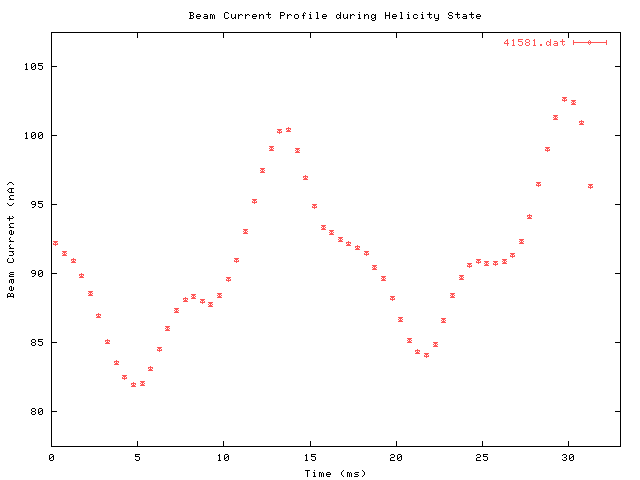
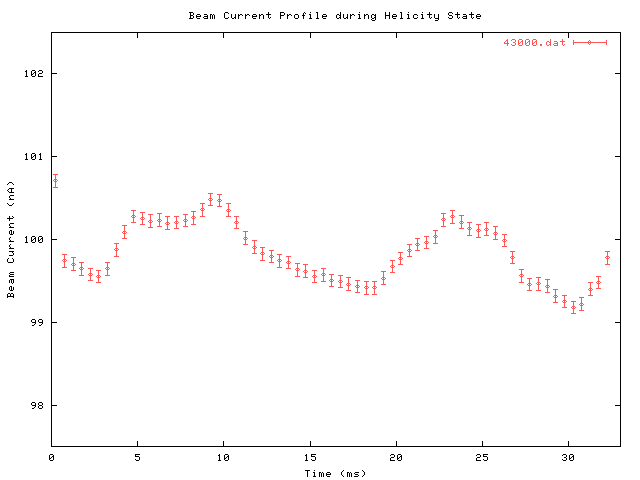
The event scaler, which reads scaler values for Clock (1MHz and 10 MHz) and beam current monitors (BCM1 and BCM2) for each event allows to determine the profile of the beam current during the 32.5 ms data acquisition period between helicity flips.
The event scaler values in the GEn01 data stream are wrong. They are magnified by an almost constant factor which is however different for each channel. The reason for that is unknown so far. The correlation between the helicity scaler and event scaler allows to determine the magnification factors from the data and apply a correction. This correction introduces a time jitter in the order of 1ms (for Q2=0.5) and 2ms (for Q2=1) because the event scaler is not read at helicity flip time. Thus start and end of the helicity period are not exactly known.
The profile is determined by averaging over roughly 1000 seconds (30000 helicity periods) of beam for Q2=0.5 and 2500 seconds for Q2=1. The error is estimated from the findings on beam current noise.
The beam current modulation is +/- 10nA for Q2=0.5 and about an order of magnitude smaller for Q2=1.
Joe Grames (expert!) gives the following explanation:
"...it looks to me like the 60 Hz line frequency. It is most likely
that the 60 Hz is modulating the beam position at the injector apertures giving you
that pattern. Particularly with low current experiments (like Hall B) where the
chopping aperture is small you see that position modulation turn into intensity
modulation. That you see it cycle almost twice during a helicity state is great news,
I think, because that is exactly what you are trying to do - average the line frequency
over the line-locked helicity frequency. Hall B in fact has a signal reporting the 60 Hz,
120 Hz, and 180 Hz beam intensity component and we make minor adjustments with
their beam to minimize it. On very bad occassions it had become as much as 5-10%;
not very good. From yor plot it looks like it is about 10% too; also, not great."