E-93026 Efficiency
GEn01 Performance
Below the plots of various performance variables vs. time. The
plots for Q2=1 get their information from the runlist which is
maintained by the shift crew and are updated automatically every night.
ND3 Efficiency
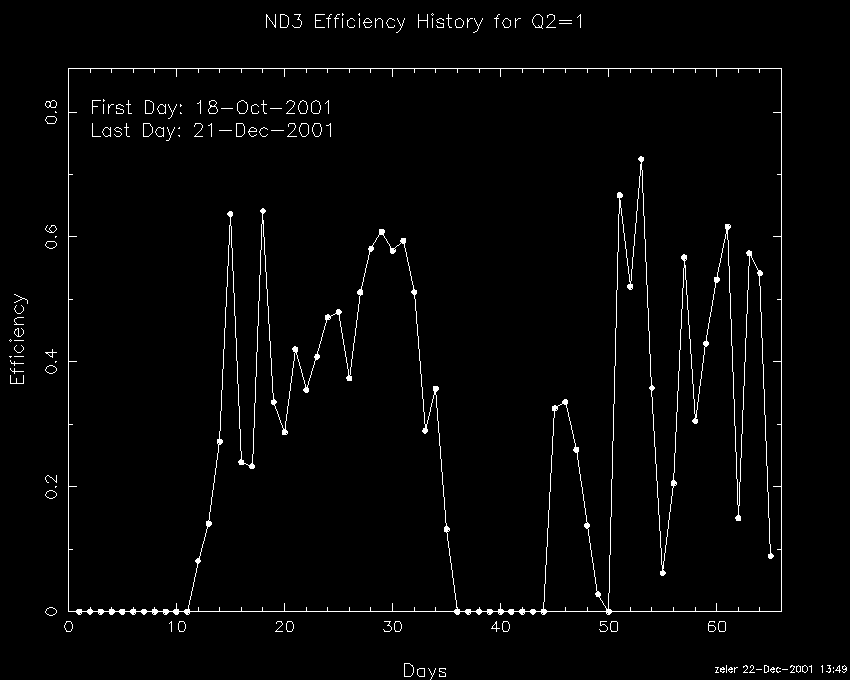
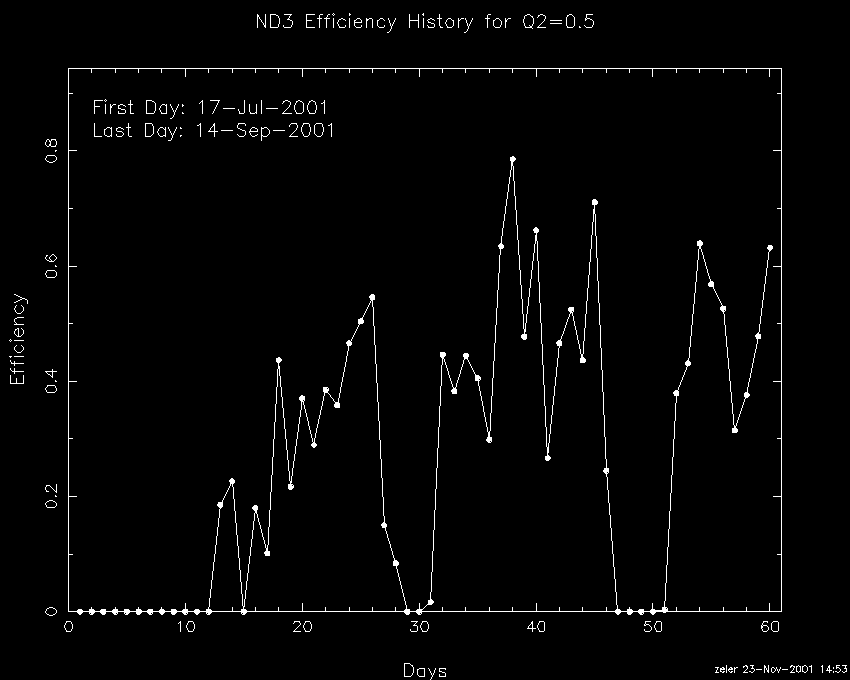
Plotted is the ND3 efficiency vs time.
ND3 efficiency is defined as pure data taking time on polarized
ND3 divided by the time that passes by. Reason for inefficiency
is any kind of downtime (LCW leaks, machine, equipment, holidays ...) and
other activities as target anneals, calibrations, moller runs etc.
Days is the number of days passed since the scheduled start of
the experiment.
Start of Q2=1 run: Oct 18, 2001 -- End run: Dec 21, 2001
Start of Q2=0.5 run: July 17, 2001 -- End run: Sep 14, 2001
Target Polarization
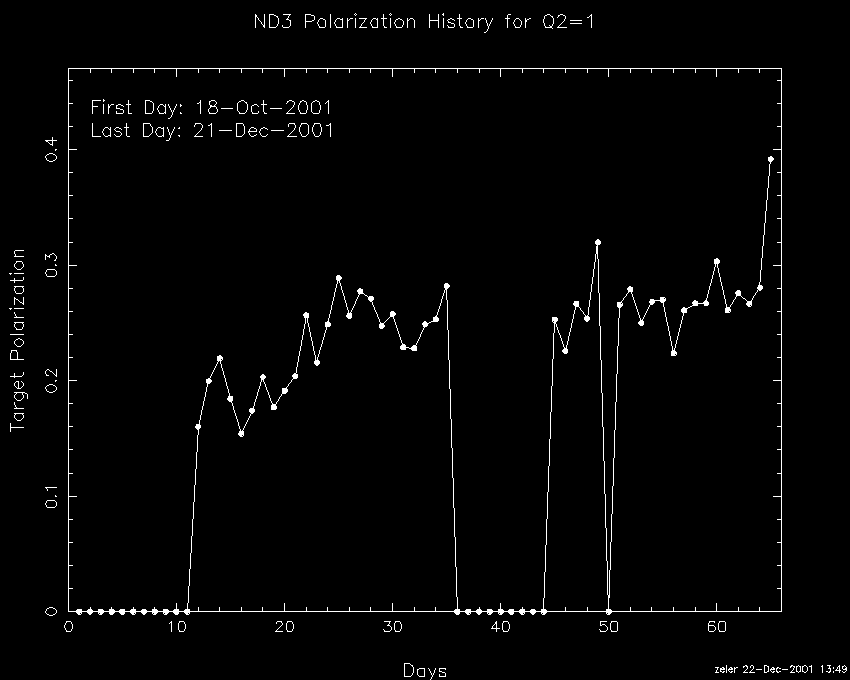
Plotted is the ND3 Polarization vs time. The ND3 Polarization is
the charge weighted average target polarization for each day.
These are online target polarizations!
Start of Q2=1 run: Oct 18, 2001 -- End run: Dec 21, 2001
Start of Q2=0.5 run: July 17, 2001 -- End run: Sep 14, 2001
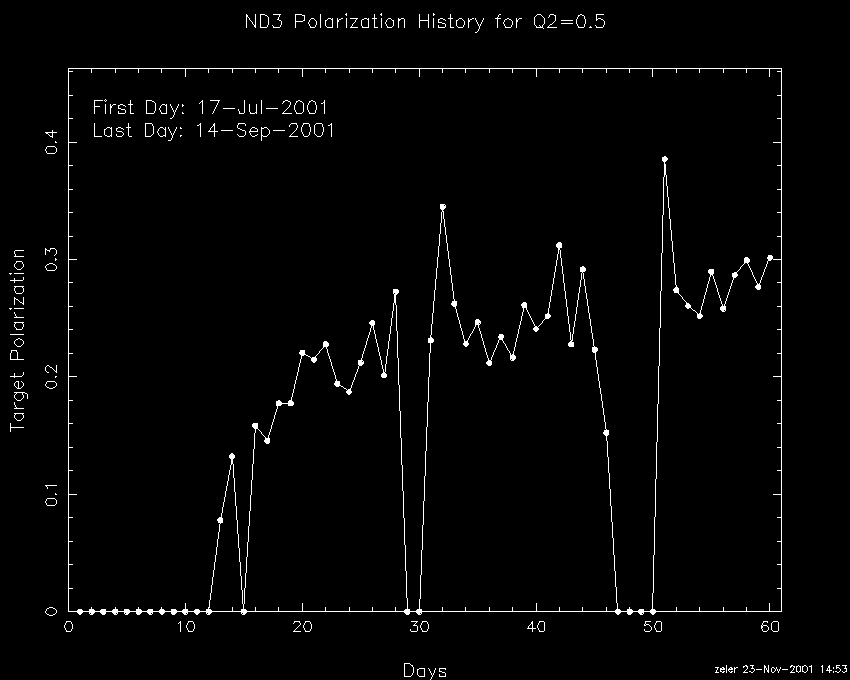
Figure of Merit
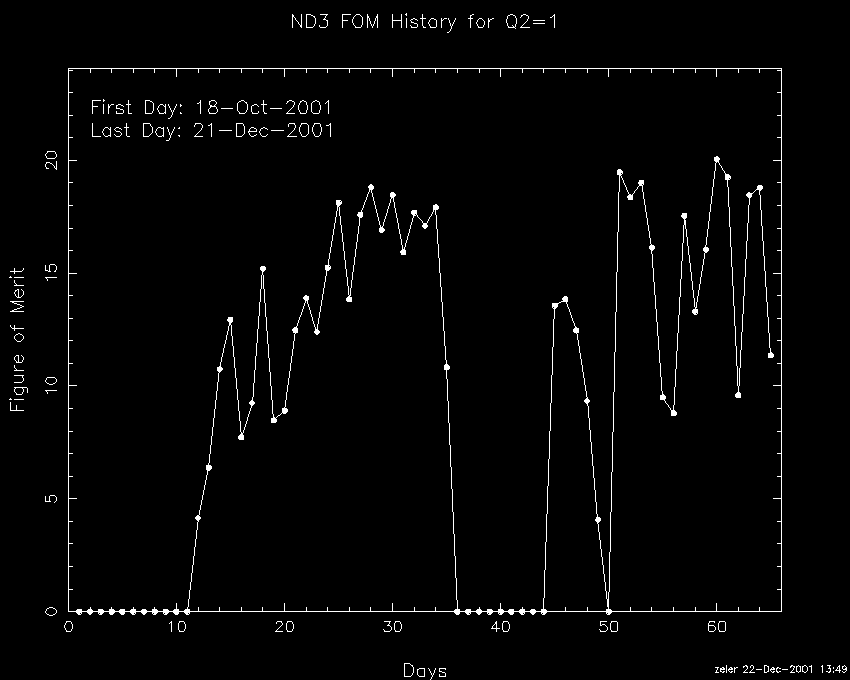
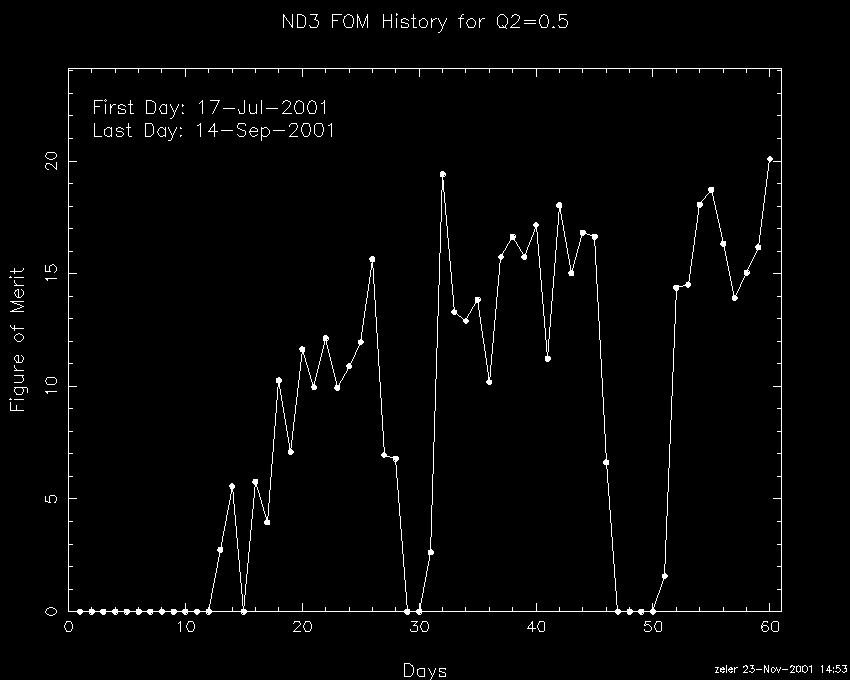
Plotted is the Figure of Merit (FOM) vs time. FOM is the product
of average target polarization and square root of accumulated charge.
Start of Q2=1 run: Oct 18, 2001 -- End run: Dec 21, 2001
Start of Q2=0.5 run: July 17, 2001 -- End run: Sep 14, 2001
Running Error
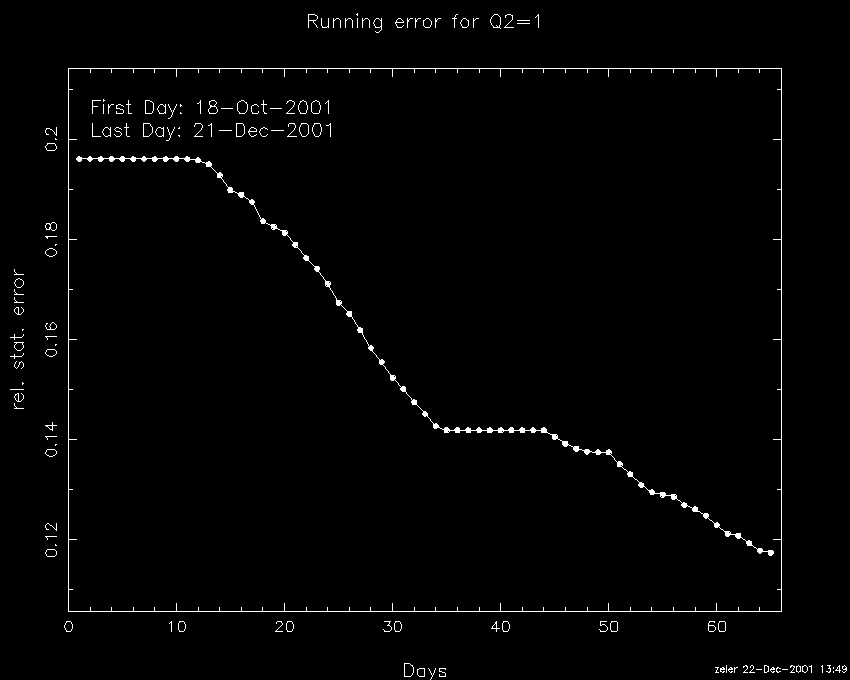
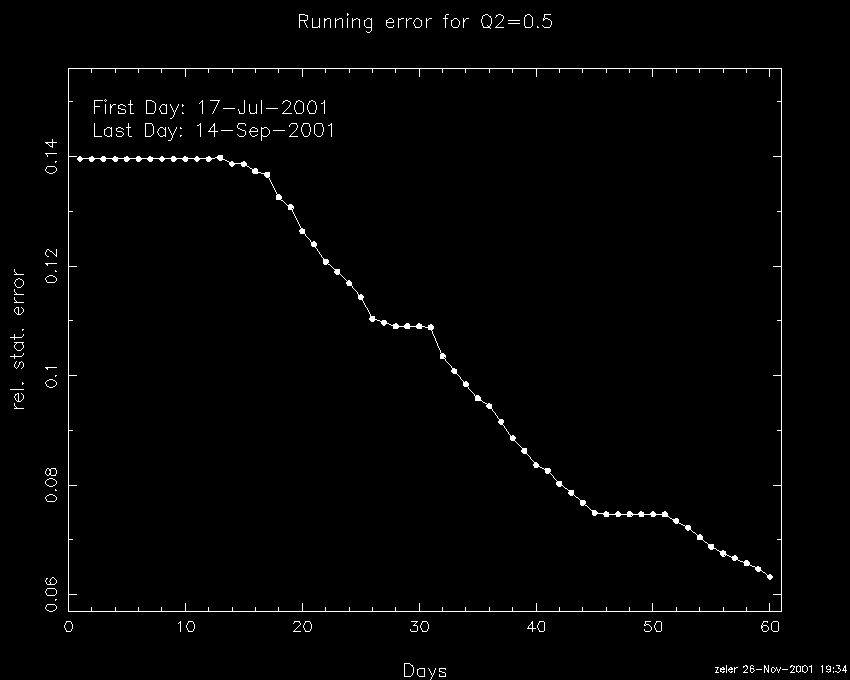
Plotted is the running relative error vs time. It is purely
statistical and assumes GEn = Galster. Further assumptions are
made on neutron rate and physics asymmetry which are not known
to better than 20%. Finally all the polarizations are online values.
So this is a rough estimate only.
Start of Q2=1 run: Oct 18, 2001 -- End run: Dec 21, 2001
Start of Q2=0.5 run: July 17, 2001 -- End run: Sep 14, 2001
Marko Zeier Markus.Zeier@unibas.ch


